Today we’ll be completing the chain and bridging the gap between Elasticsearch where our alerts currently sit, and TheHive where the alerts will become cases for analysis.
Install ElastAlert
ElastAlert currently requires Python 2.7
You can install it on any server you wish, I’m installing it on the Elasticsearch server.
sudo apt install python-pip
pip install elastalert
Installed to: /home/username/.local/bin/elastalert
There is also a Docker version available.
Configure ElastAlert
Create a directory to store the config and rules.
mkdir -p ~/elastalert/rules
Get the template here or just make your own config.yaml and copy just the necessary settings below. Save this as ~/elastalert/config.yaml.
My settings are:
rules_folder: /home/username/elastalert/rules
run_every:
  minutes: 1
buffer_time:
  minutes: 15
es_host: x.x.x.x
es_port: 9200
use_ssl: False
writeback_index: elastalert_status
alert_time_limit:
  days: 2
Run elastalert-create-index to create the necessary index in Elasticsearch.
You should get back:
Elastic Version:6
Mapping used for string:{'type': 'keyword'}
New index elastalert_status created
Done!
Create a Rule
Go to TheHive > Admin > Users
Create a new user named elastalert with no roles and check the box to “Allow alert creation”.
Click the “Create API Key” button and copy the API key for later.
TheHive Administrator’s Guide notes that once a user has been created the account cannot be deleted, only locked. This is for audit purposes.
Each rule defines a query to perform, parameters on what triggers a match, and a list of alerts to fire for each match.
I’m going to create a rule to identify failed SSH login attempts, designated by rule.id: "5710". I discovered this by looking over my logs in Kibana.
nano ~/elastalert/rules/failed_ssh_login.yaml
es_host: x.x.x.x
es_port: 9200
name: SSH Failed Login
type: frequency
index: wazuh-alerts-3.x-*
num_events: 2
timeframe:
    hours: 1
filter:
- term:
    rule.id: "5710"
alert: hivealerter
hive_connection:
  hive_host: http://x.x.x.x
  hive_port: 9000
  hive_apikey: <Paste API key for elastalert user here>

hive_alert_config:
  type: 'external'
  source: 'elastalert'
  description: '{rule[name]}'
  severity: 2
  tags: ['{rule[name]}', '{match[agent][ip]}', '{match[predecoder][program_name]}']
  tlp: 3
  status: 'New'
  follow: True

hive_observable_data_mapping:
    - ip: "{match[src_ip]}"
Notice the last block that maps Observables to Types.
Note Although you can address nested field names ({match[data][srcip]} in the TAG field above) in the Tags field, the same does not appear to work for hive_observable_data_mapping. Only single-name fields ('{match[srcip]}') can be used.
We need to modify our Logstash 01-wazuh.conf file to account for this.
Go to the Logstash server and modify your 01-wazuh.conf file.
Change the [data][srcip] filter to read add_field => [ "src_ip", "%{[data][srcip]}" ] instead of add_field => [ "@src_ip", "%{[data][srcip]}" ]
Change the source => "@src_ip" in the geoip filter to read source => "src_ip".
This src_ip field should now be in your logs. Use Kibana to verify.
In Kibana you should also go to Management > Kibana > Index Patterns, select the wazuh-alerts index pattern, and click the Refresh icon to update the pattern with the new field.
Now continue on.
Test your rule:
elastalert-test-rule ~/elastalert/rules/failed_ssh_login.yaml
Run ElastAlert:
elastalert --verbose --config ~/elastalert/config.yaml
Now generate some alerts against your Linux box running the Wazuh agent.
Run the following command 3 times in a row: ssh invaliduser@serverip
You should see the alerts show up in Kibana and ElastAlert should pick them up the next time it runs.
INFO:elastalert:Ran SSH Failed Login from 2019-03-31 18:21 UTC to 2019-04-02 15:01 UTC: 3 query hits (0 already seen), 1 matches, 1 alerts sent
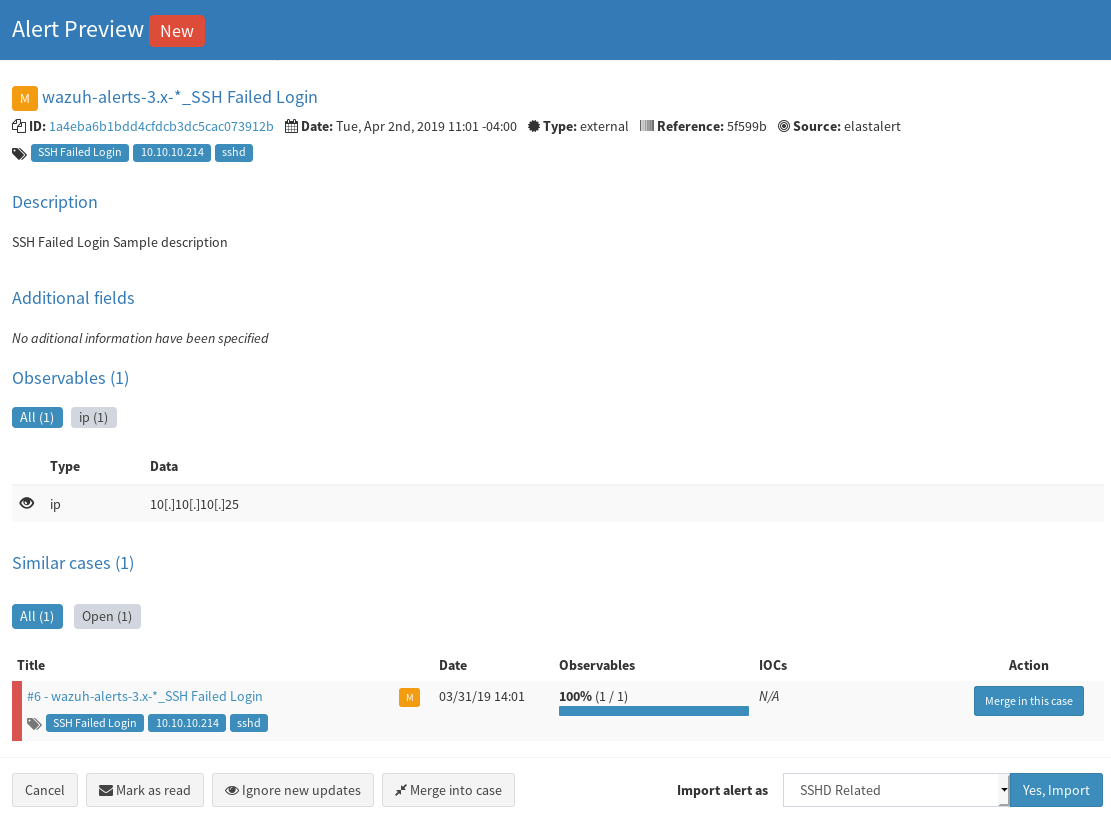
This will cause a new alert to be generated in TheHive under “Alerts”.

Click the page icon on the right to preview the alert, assign it a template if you have one, and import it.

Congratulations. We can now generate an alert from Wazuh and have it appear as a case in TheHive.