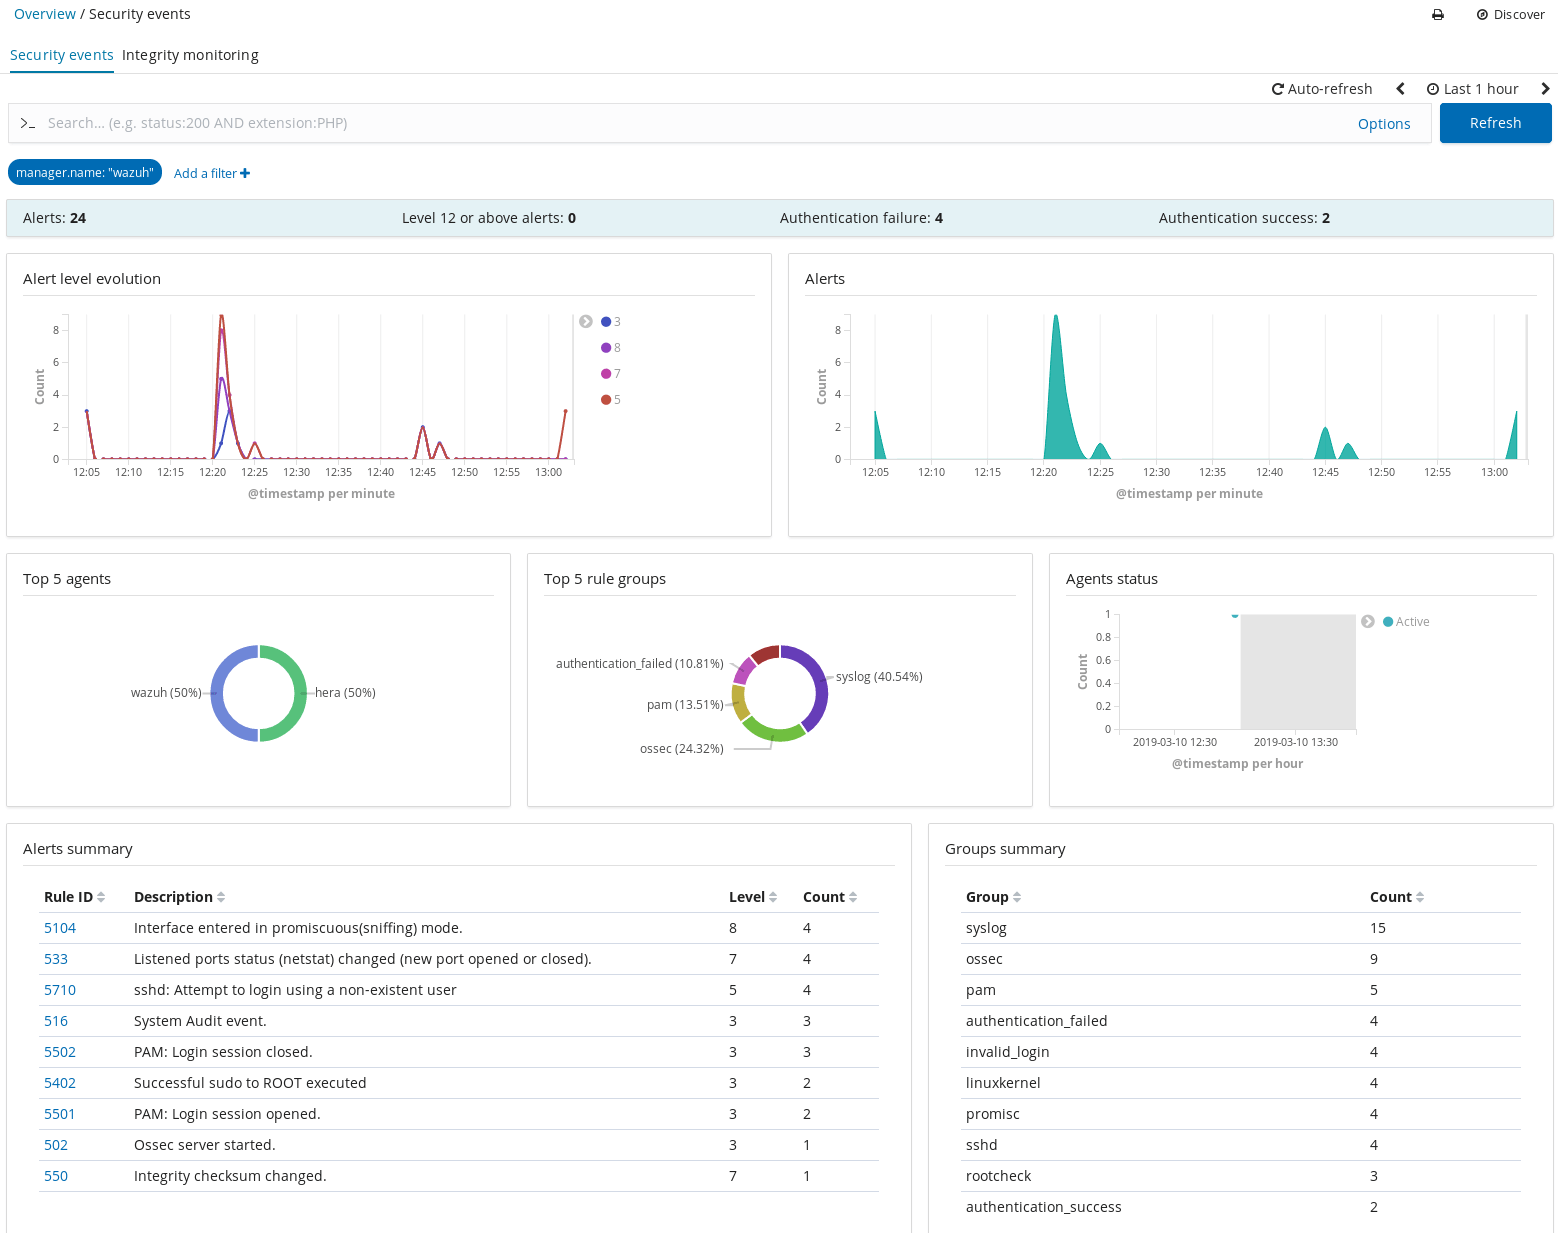
Today we’ll be installing Wazuh Manager on a new server, registering an agent, and integrating Wazuh with Elasticsearch.
We’ll use the Wazuh agent and its ruleset to identify activity of interest on our endpoint (workstation) and generate an alert. That alert is forwarded from the wazuh-agent to the wazuh-manager where it is written to /var/ossec/logs/alerts/alerts.json. The Filebeat service constantly monitors this file for changes, and forwards those entries to Elasticsearch.
The instructions below detail the installation of version 3.8. To use a different version (such as 3.9) just change the version numbers where specified. Remember to do this for the installation, but also when loading the template, logstash configuration, and Kibana app.
Install Wazuh Manager
Install GPG key for the Wazuh repository:
curl -s https://packages.wazuh.com/key/GPG-KEY-WAZUH | apt-key add -
Add the repository:
echo "deb https://packages.wazuh.com/3.x/apt/ stable main" | tee -a /etc/apt/sources.list.d/wazuh.list
Update:
sudo apt update
Install Wazuh Manager:
sudo apt install wazuh-manager=3.8.2-1
Wazuh API
Wazuh API is necessary for Kibana integration
The default user/password for the Wazuh API is foo/bar. There are instructions here if you want to change that.
Install NodeJS:
sudo curl -sL https://deb.nodesource.com/setup_8.x | bash -
sudo apt install nodejs
Install Wazuh API:
sudo apt install wazuh-api=3.8.2-1
Set the two packages not to auto-update:
sudo apt-mark hold wazuh-manager
sudo apt-mark hold wazuh-api
Install Filebeat
curl -s https://artifacts.elastic.co/GPG-KEY-elasticsearch | sudo apt-key add -
sudo echo "deb https://artifacts.elastic.co/packages/6.x/apt stable main" | tee /etc/apt/sources.list.d/elastic-6.x.list
sudo apt update
sudo apt install filebeat=6.6.1
Hod the Filebeat package:
sudo apt-mark hold filebeat
Download the Filebeat configuration file:
sudo curl -so /etc/filebeat/filebeat.yml https://raw.githubusercontent.com/wazuh/wazuh/3.8/extensions/filebeat/filebeat.yml
Edit the configuration:
sudo nano /etc/filebeat/filebeat.yml
Replace YOUR_ELASTIC_SERVER_IP in the output section at the end with the real IP of the Elasticsearch 6.6.1 server. Later we will load a Logstash config on that server to listen on this port.
Start end enable the Filebeat service:
sudo systemctl daemon-reload
sudo systemctl enable filebeat.service
sudo systemctl start filebeat.service
Load the Wazuh Template
Load the Wazuh template for Elasticsearch. Run this command on the Elasticsearch host.
curl https://raw.githubusercontent.com/wazuh/wazuh/3.8/extensions/elasticsearch/wazuh-elastic6-template-alerts.json | curl -X PUT "http://localhost:9200/_template/wazuh" -H 'Content-Type: application/json' -d @-
Load the Logstash Config
Download the logstash configuration file for a remote installation of Wazuh server. Run this command on the Elasticsearch host.
curl -so /etc/logstash/conf.d/01-wazuh.conf https://raw.githubusercontent.com/wazuh/wazuh/3.8/extensions/logstash/01-wazuh-remote.conf
Make sure the logstash service is running with the new config.
sudo systemctl restart logstash.service
Install the Kibana plug-in
This also gets run on the Elasticsearch host which is where Kibana is installed.
I first attempted to run the command provided in the Wazuh documentation:
sudo -u kibana NODE_OPTIONS="--max-old-space-size=3072" /usr/share/kibana/bin/kibana-plugin install https://packages.wazuh.com/wazuhapp/wazuhapp-3.8.2_6.6.1.zip
and received the error:
Plugin installation was unsuccessful due to error "Command failed: /usr/share/kibana/node/bin/node /usr/share/kibana/src/cli --env.name=production --optimize.useBundleCache=false --server.autoListen=false --plugins.initialize=false
Browserslist: caniuse-lite is outdated. Please run next command `npm update caniuse-lite browserslist`
Running npm update caniuse-lite browserslist by itself errors because Node isn’t installed on this machine.
So I uninstalled the plugin and ran the command again without the NODE options:
sudo -u kibana /usr/share/kibana/bin/kibana-plugin install https://packages.wazuh.com/wazuhapp/wazuhapp-3.8.2_6.6.1.zip
and it finished successfully. Now reboot.
Install the Wazuh Agent
Follow these instructions for installation depending on your platform. I’m installing the agent on a Linux workstation.
After installation, you need to edit the agent ossec.conf with the IP of the Wazuh Manager server.
On Debian agent is installed to /var/ossec
sudo nano /var/ossec/etc/ossec.conf
Change MANAGER_IP under <ossec_config>
Now restart the service: sudo systemctl restart wazuh-agent=3.8.2-1
Agent Registration
You now need to associate the server and agent. You do so by registering the agent.
We will do so using the simple, insecure method.
-
On the Manager, start the registration service by running:
/var/ossec/bin/ossec-authd -
On the agent, run the agent-auth program, using the Manager’s IP address:
-
For Linux systems:
/var/ossec/bin/agent-auth -m <MANAGER_IP_ADDRESS> -
For Windows systems:
C:\Program Files (x86)\ossec-agent\agent-auth.exe -m <MANAGER_IP_ADDRESS>
-
You should get back:
INFO: No authentication password provided.
INFO: Connected to xxx.xxx.xxx.xxx:1515
INFO: Using agent name as: xxxxxxx
INFO: Send request to manager. Waiting for reply.
INFO: Received response with agent key
INFO: Valid key created. Finished.
INFO: Connection closed.
Wazuh Dashboard
Connect to Kibana and you should see a new icon on the left hand toolbar named Wazuh. Clicking this brings you to a page asking for the API configuration
Username: foo
Password: bar
Server: http://<WAZUH_Server_IP>
API Port: 55000
Save the API entry and now click on “Overview” at the top of the page. A screen should come up showing all green checkmarks and then show you the Overview page.
Clicking on “Agents” on the top menu bar should show you an agent with ID 001, the workstation you registered earlier. Hopefully it shows a status of “Active” otherwise you may need to revisit the workstation. Make sure you restarted the agent service after changing the MANAGER_IP.

Testing
Let’s explore the index and generate an alert.
In Kibana navigate to Management > Elasticsearch > Index Management.
You should see a “wazuh-monitoring-3.x” index.
Now move over to Management > Kibana > Index Patterns and if you don’t already have a default index pattern defined then click on wazuh-monitoring and then click the star in the upper right to make this the default.
Now click on Discover to see any events that have been created. There’s probably not much interesting to see yet.
Go back to the Elasticsearch Index Management page and wait until a new index appears named wazuh-alerts. We’ll try and make it appear by generating an alert.
As a test go to another workstation and attempt to ssh into the workstation with the name of a fake user: ssh fakeuser@<wazuh_agent_IP>
This should result in an invalid login attempt showing in the workstation’s auth.log which will get picked up by the Wazuh agent resulting in a log entry in a newly created wazuh-alerts index.
We now have a repository with actionable alerts.