I’ve been fortunate to have spent the last few months working with Siemplify and watching it evolve from version 4 to the recently released version 5. Siemplify is a SOAR solution which stands for Security Orchestration, Automation, and Response. It enables case management and the running of Playbooks on incoming alerts, with the goal of reducing the amount of time an analyst must spend on repetitive tasks which can be easily automated. After an enrichment phase the analyst can better make quick, informed decisions as to how to proceed, and can be assured that actions performed are as expected without the possibility of forgetting or missing a step.
Below I’ll do a high-level introduction of Siemplify’s main tabs, and in later posts I’ll dive deeper into playbook creation and case management.
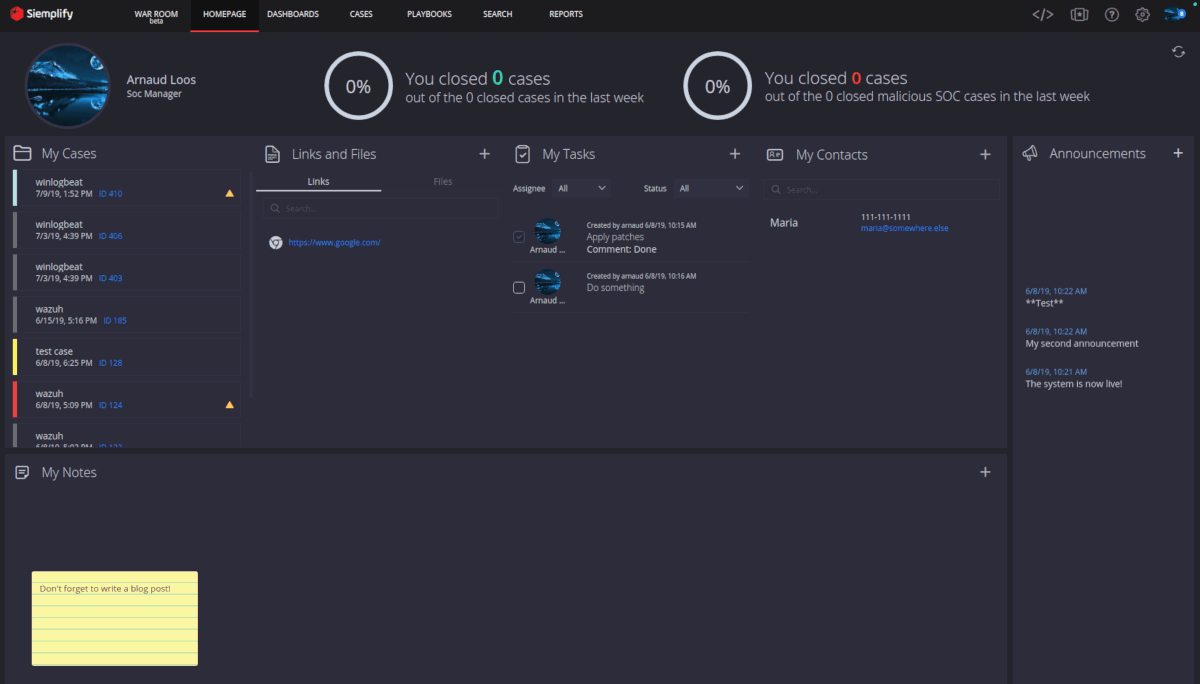
We’ll start with the Analyst Homepage. On this screen each analyst can track their assigned tasks and cases, as well as setup shortcuts to their frequently accessed files and links. A scrolling announcements side-bar allows the SOC Manager to keep the whole team up-to-date with current events.
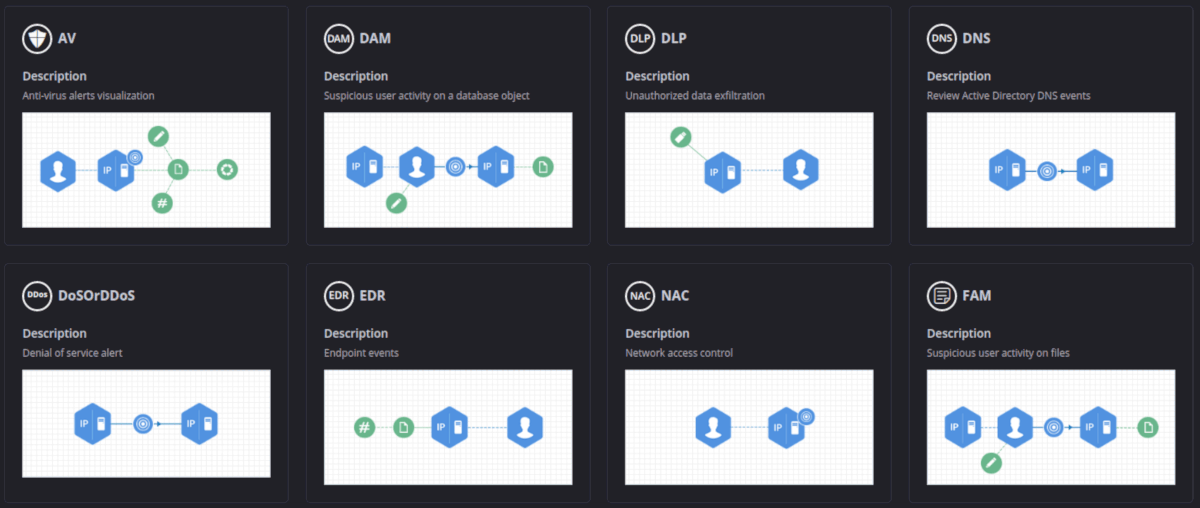
Siemplify requires a connector to an event source in order to ingest alerts. Numerous connectors are available to various SIEM platforms, as well as Email mailboxes, ServiceNow, and for many of the products listed in their Marketplace.
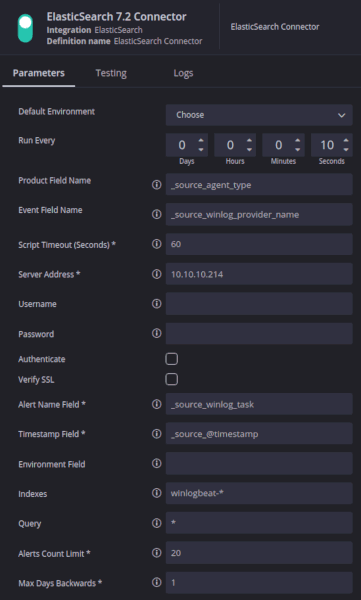
Below I’m connecting to Elasticsearch 7.2. Along with server and user connection details we also do some preliminary field mapping of product, event, and alert name fields. These can be pulled from the testing tab after a test connection has been established.
Once a connector has been established to an alert source, some additional field mappings must take place. Siemplify has its own internal schema and requires that the fields from the alert be mapped to its entity fields. Example entity fields would be SourceUserName, DestinationHostName, DestinationDomain, FileHash, URL, etc. Along with this field mapping you must select a Visual Model which best represents the relationship of the entities. This Visual Model determines how the various entities are connected together. For example, in most Visual Models SourceHostName and SourceAddress would be linked because the machine’s IP address is linked to its name.
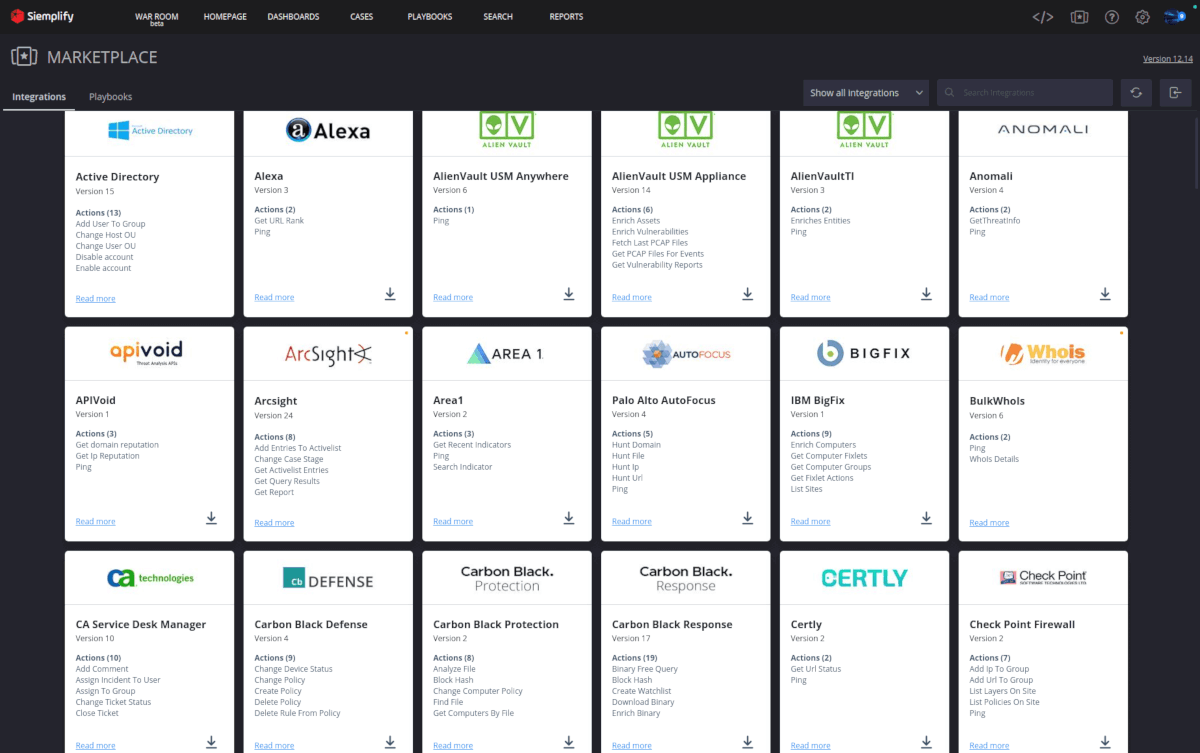
Now that we’re properly parsing our alerts it’s time to start working with them. In order to do so we must first visit the Siemplify Marketplace (from within the application) and install all the Integrations we want to use. Some will require very little configuration while most will require an API key and credentials.
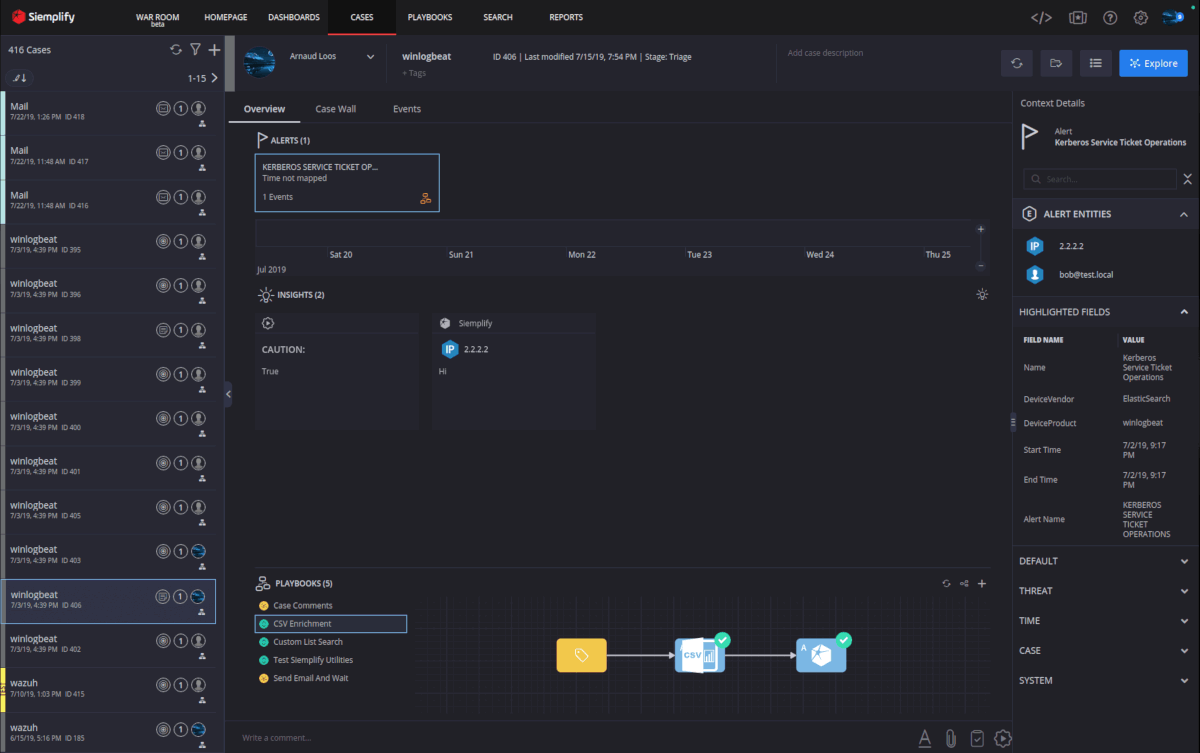
Navigating to the Cases tab will show us all the cases that are open within Siemplify, regardless of the analyst assigned. From here we can take ownership of a case and begin to work it.
The Overview tab will show us one or more alerts grouped within the case. These alerts correspond to events listed on the Events tab. We can see a timeline display of the events as well as any Insights that have been called-out from running a playbook. The Playbook pane on the bottom shows us the playbooks attached to the alert as well as their status.
Entities mapped earlier are shown in the right-hand column along with additional case details. Clicking on an entity will take you to it’s details page where you can see statistics about where this entity has been seen before.
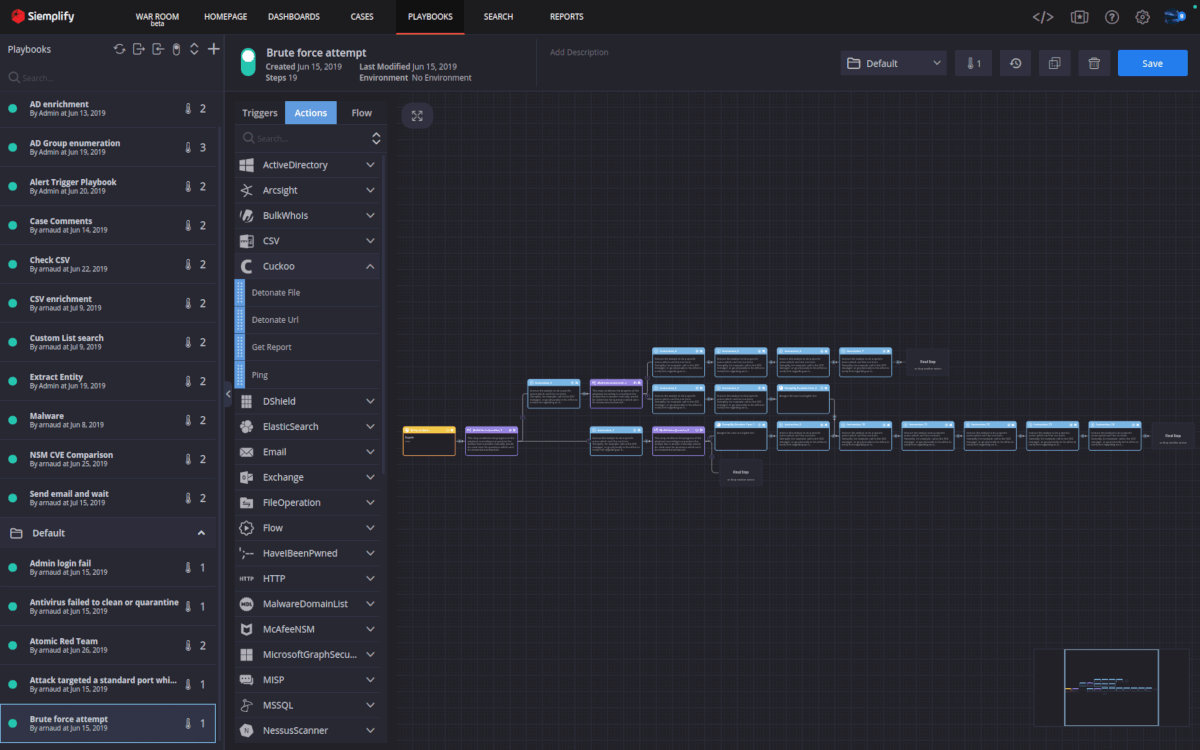
The playbooks that run against alerts are designed on the Playbooks tab. Each playbook must contain one trigger and at least one action. Actions are scoped to entities. So you may start with the Active Directory action to “Enrich Entities” and scope that to just “Internal User” entities. Siemplify is able to make this determination because during setup you told it about all the Domain names you own. So when it sees sallie@corp.local and you have corp.local defined as an internal Domain, it knows Sallie is internal. The same method can be used for nework actions such as Palo Alto’s “Add IP to Block Group” action. We scope this to “External IPs” and Siemplify will make that determination based on the network ranges you have defined.
When a playbook action runs, such as Active Directory’s “Enrich Entity”, it results in Siemplify gaining additional data about an entity (enrichment). With this method we gain additional data points such as LastLogonTime. Enriching through your AV solution may allow you to associate a machine name to the IP from the alert, as well as list the last scan results. Based on the result of the last scan we can add a branching conditional to our playbook to execute one sequence of actions if the scan reports clean, and a different set of actions if there’s an infection. If the machine is infected we may want to contain it until the analyst can review the case. This is how you build out a playbook. Ideally your procedure for handling each alert is already defined and Siemplify is merely automating the execution of actions you’ve previously been doing manually.
You can automate as much or as little as you want on an alert. Many environments will want to run an enrichment playbook to ensure as much data as possible is attached to the case when the analyst begins their investigation. Some alert categories may need some automated decisions to occur to filter down their numbers before an analyst sees them, and others can be fully automated away.
As you can see below, building the playbook means dragging the desired action from the left-hand column and placing it in the proper step in the sequence. Then it’s just a matter of ensuring you have the right information coming from the action outputs to feed into the next action inputs.
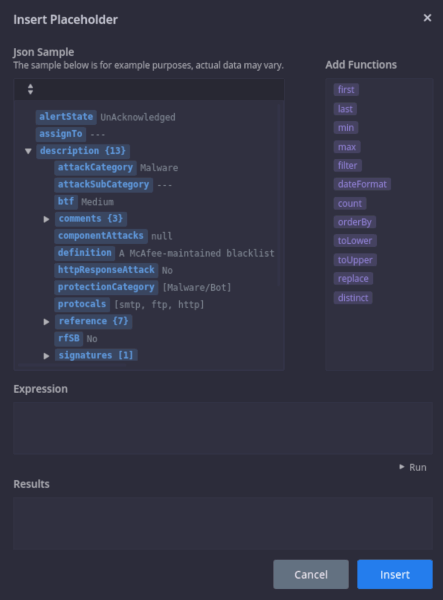
Version 5 of Siemplify includes a new expression builder component. With the expression builder you can look at the JSON results of a previous action in the playbook and target its fields directly.
The image below is the example output from the McAfeeNSM “Get Alert Data” action. This allows me to select any placeholder field from the list when designing my playbook, allowing me to see what the data in that field will look like for a real alert. This is very useful if for example I want to select a specific field from the previous action’s output as input to my current action.
The final components to note are the Dashboards page and the new War Room.
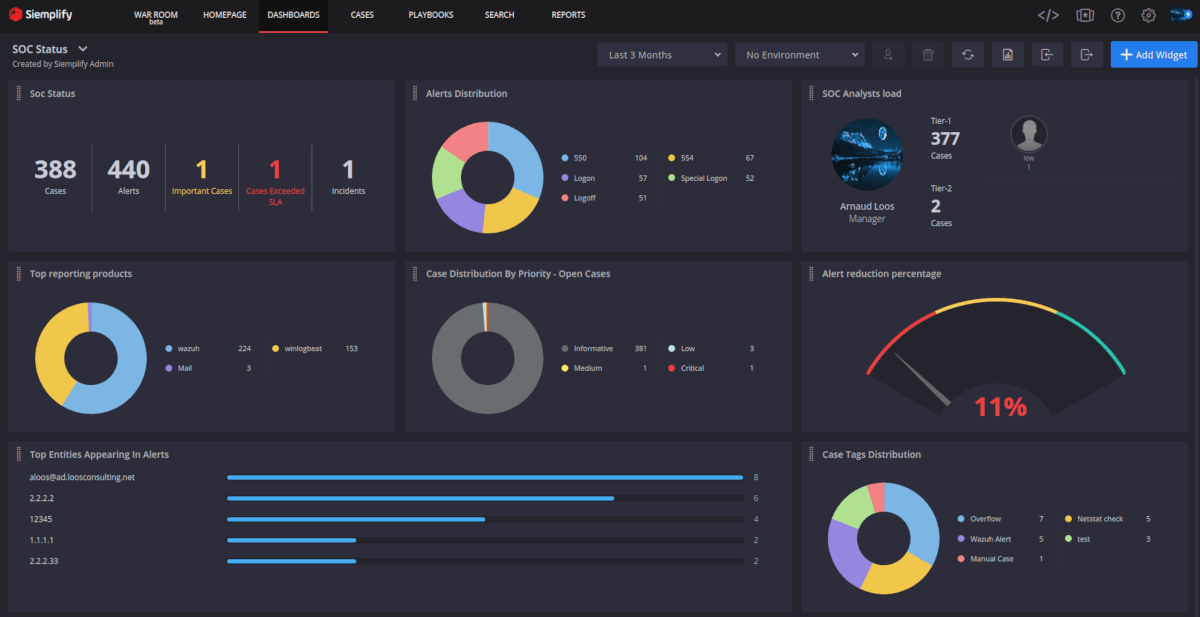
Dashboards and Reports allow you to keep track of your SOC metrics and guage your analyst’s closure rate. Siemplify includes both of these capabilities but I won’t explore this much other than to show the example dashboard below. With the next release all the dashboarding and reporting will be changing for the better so stay tuned.
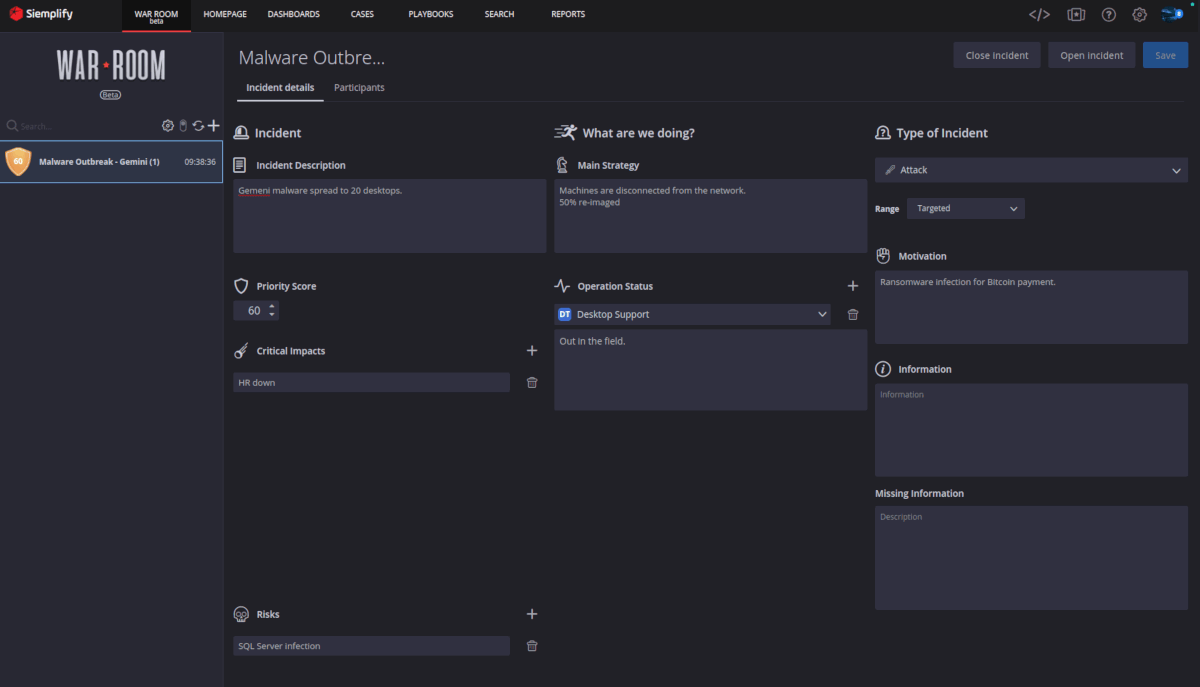
The War Room is a new feature allowing the SOC to “Raise an Incident” and coordinate activities with outside parties. The key here is the ability to invite anyone, anywhere into the War Room where they can stay apprised of what’s happening as well as contribute their updates. The people you invite don’t need to have Siemplify accounts or licenses, but are still able to share their updates with the group. The War Room administrator can set check-in deadlines for status report updates and update all departments through one interface. It’s completely up to you under what circumstances you choose to start a new incident.
I hope you enjoyed this overview. In future posts I’ll dive deeper into specific playbooks to really see how automation can allow analysts to focus on the most important cases. We’ll also explore ways of gracefully handling those less-critical alerts that would otherwise go unhandled.