PCAP files play a critical role in network troubleshooting and security. When an issue arrises and Developers are pointing at the SysAdmin who are pointing at the Network Admins, a PCAP capture will give you the unbiased answer. Depending on the amount of traffic and length of the capture however, these files can be extremely daunting to look at when first opened. Where do you start in a capture with 200,000 entries?
Often you don’t need to dig into individual packets to get the answer you’re looking for. Even if you do end up there, you still need a place to start. In this post I’ll be looking at three different ways to get a high-level overview of the traffic in your PCAP. The goal is to give you a sense of who the high traffic endpoints are, where they reside, and who they’re communicating with.
GrassMarlin
The first tool we’ll be looking at is GrassMarlin, an open source tool released by the NSA. It’s primary purpose is to help passively map Industrial Control Systems and SCADA networks, and that’s what it’s fingerprint database is centered around, but it works just fine for our purpose as well.
It’s a Java application and can be installed on Windows or Linux. I won’t go over the installation as I just selected all the defaults. The full documentation is available here.
I’m going to assume you have a PCAP file you want to analyze. I just downloaded a random one off the Internet.
Once the application is running, click the “Import Files” button in the toolbar or from the file menu. Click “Add Files” to add it to Pending Imports. Highlight it and select “Import Selected”.
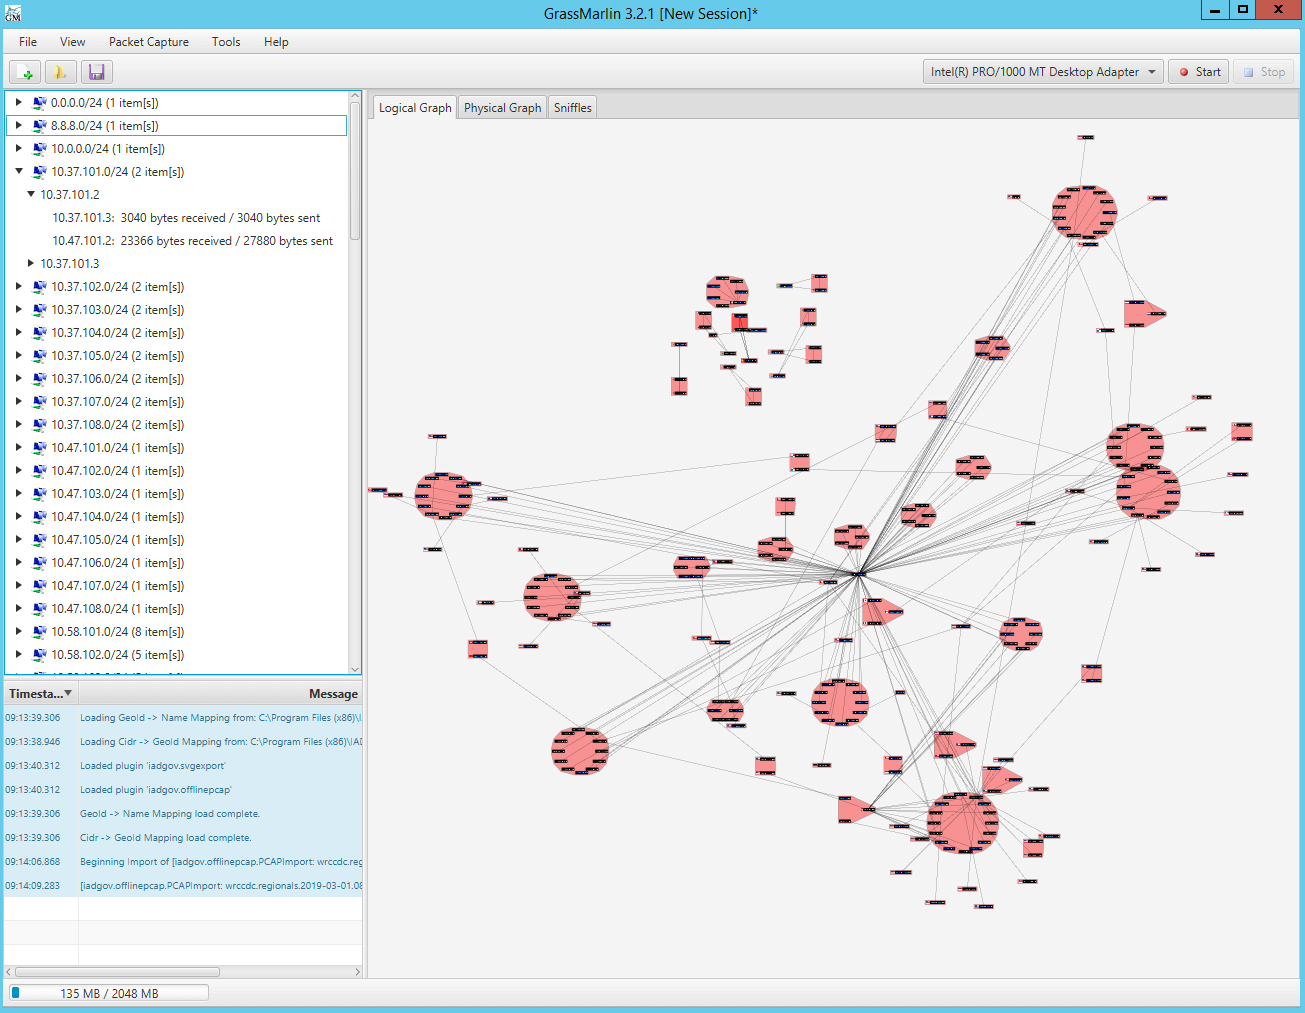
The first view you will see is the Logical Graph. Here each node that communicated in the PCAP is represented. The red circles are groupings. By default the Nodes are grouped by network, but this can be changed.
I like to modify the view a little.
Right-click the Logical Graph and select “Weight Edges by Byte Count”. The darker the line, the more traffic was transmitted.
Right-click the Logical Graph and select “Use Curved Edges”
Other than the Logical Graph, you also have tabs for Physical Graph and Sniffles. Physical Graph requires some additional configuration. Basically you export your running-config from your Cisco devices and import them into GrassMarlin. Then, under this tab, it’s able to show connections grouped by Switch and Router.
The Sniffles tab is extracted from 802.15.4 data contained in the PCAP. This is meant to group devices on a Mesh network. The necessary metadata may not be present in a default PCAP.
Other than the Graph windows you also have a “Message Log” that will display updates and errors at the bottom left, and above this is a tree view that mirrors what you see in the graph.
After having analyzed this view, right-click anywhere in the Logical Graph and change “Group By” to Host Name. This will essentially remove the red coloring of groups on the map. Now right-click the graph again and select “Run Layout Now”. Unless you change the grouping first the second command does nothing.
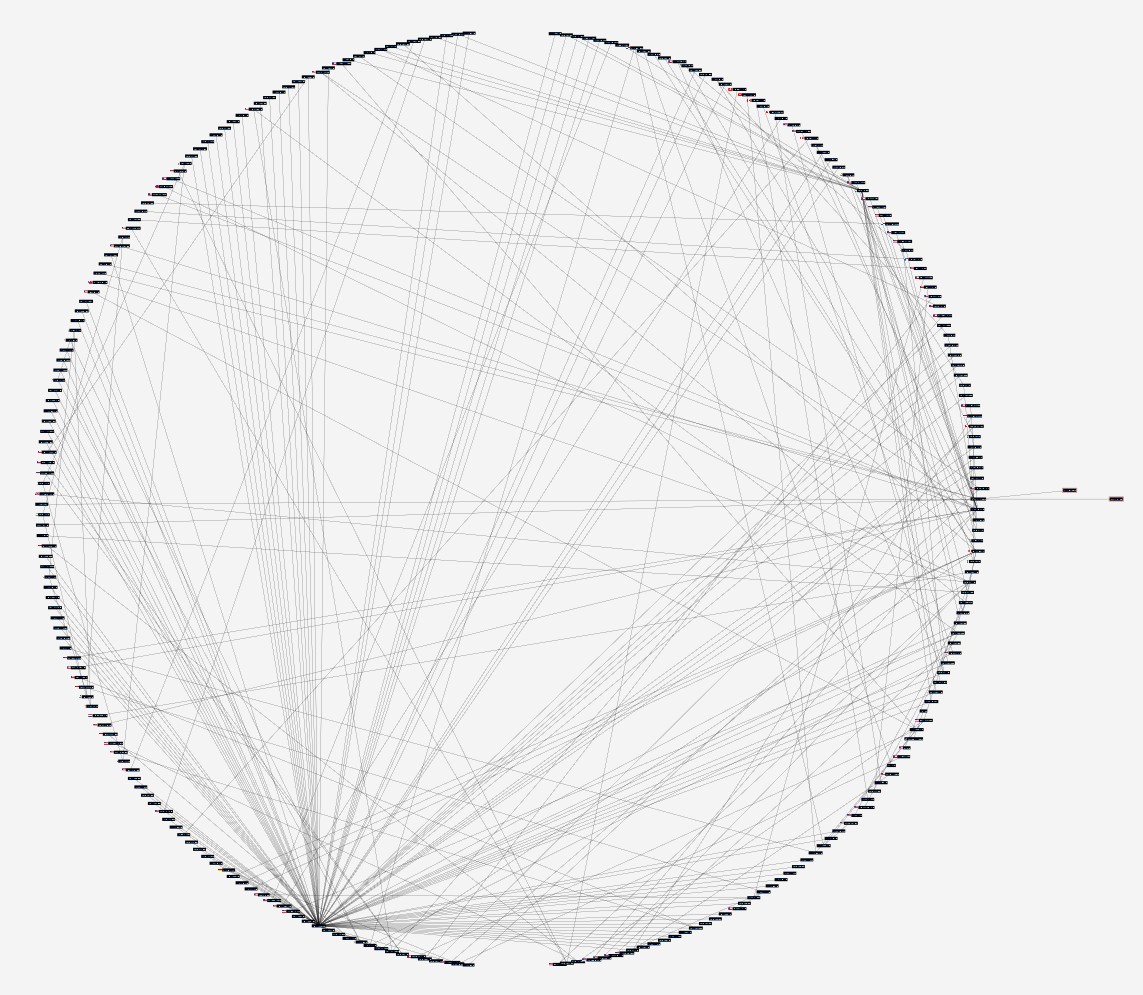
This is the view that best allows me to visually interpret the full contents of the PCAP. I can clearly see a node on the bottom left communicating with lots of peers, as well as a dark line almost through the center showing a high amount of traffic passing between two nodes. Then there’s also the two outliers off to the right. All of these data points can allow me to hone in on the important traffic more easily. Maybe this is traffic that needs to be analyzed further, or maybe these are sources of noise preventing me from finding the interesting data, in which case excluding them from further analysis will probably trim the number of remaining packets by more than 50%.
NetworkMiner
The next tool we’ll look at, NetworkMiner, can only be installed on Windows. I’m also using the free version as opposed to the more full-featured commercial version. An installation isn’t even required, simply unzip and run the executable.
We’ll be using NetworkMiner for it’s sorting and categorization capabilities. By default when you first open your PCAP you’re presented with the hosts sorted by IP address.
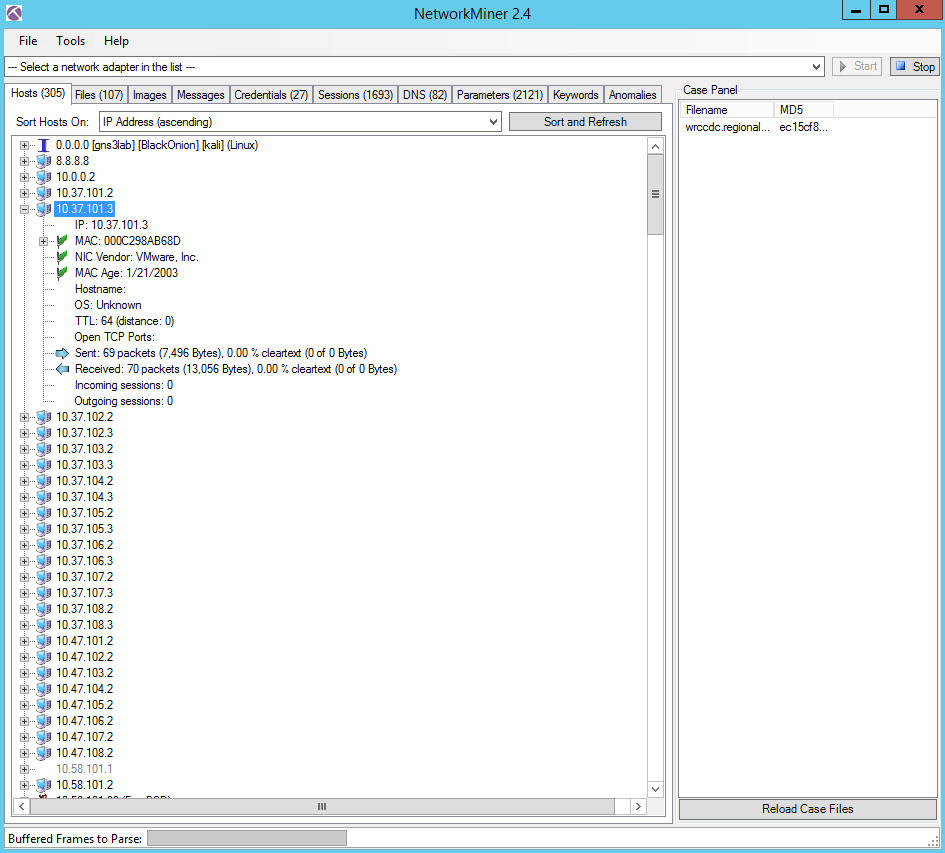
Just under the tabs you’ll see “Sort Hosts On:”. Select “Sent Packets (descending)” to see your chattiest endpoints. There’s obviously many other sorting options under here as well.
You’ll also notice other tabs across the top. Here NetworkMiner has followed and categorized conversations between endpoints and attempted to extract and reconstruct the contents. These tabs allow you to see what was transferred and what category or tab those communications fall under. Most likely some of these tabs are empty, but quickly glancing at the numbers next to the tab headers allows you to see what the bulk of the traffic spent time transferring.
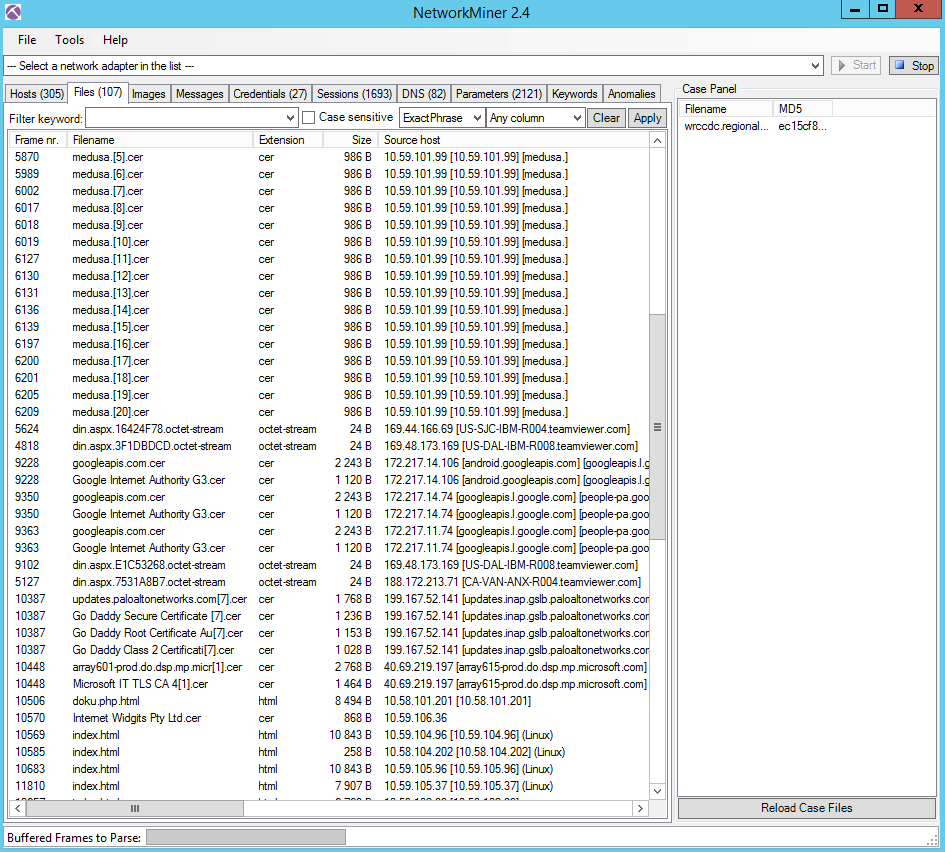
Extracting credentials is a nice feature also.
Wireshark
Last but certainly not least is our favorite PCAP analysis tool of all, Wireshark.
For high-level analysis we’ll focus on the Statistics menu at the top.
Statistics > Summary
Look here under “Time” to see the duration of the capture.
Statistics > Protocol Hierarchy
This will show what type of network traffic you’re dealing with. Most likely this will be IPv4 TCP traffic but it doesn’t hurt to check.
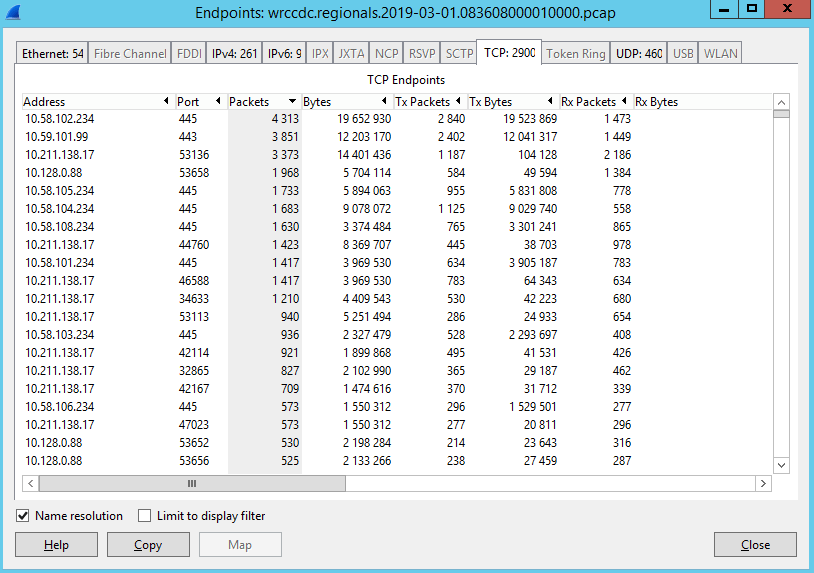
Statistics > Endpoints > TCP
Here you can sort by port and packet count. Useful for honing in on the ports and services doing most of the talking.
Statistics > IO Graph
This will show you the distribution of packets over time. Is the distribution consistent or are there bursts of traffic you may want to focus on?
Statistics > IP Statistics > Source and Dest IP Addresses > Create Stat
Another way of sorting the endpoints by packet count. Who sent the most traffic and who received the most.
Remember that the goal of this exercise is to enable you to focus on the traffic that matters most to you. By taking the noisiest sources and either including or excluding them from your filter you’ll be best able to find the IPs and conversations that matter. Once you’re done filtering and have a list of IPs of interest, I like to go back and undo my existing filters and now filter by IP. I may have excluded a noisy endpoint early on and wouldn’t see if my suspect IP ever communicated with those excluded endpoints.
On first pass filter often and find those suspect IPs. On the second pass focus on those suspect IPs and everyone they communicated with.