We now have a working pipeline starting with an alert being triggered at our endpoint, through escalating that alert into TheHive. Once we have an alert we can begin the process of case creation, task assignment, IoC enrichment, and ultimately case closure. Let’s walk through this process in more detail.
Creating Cases from Alerts
You should begin by navigating to Users in the Admin menu to create unique accounts for all Analysts.
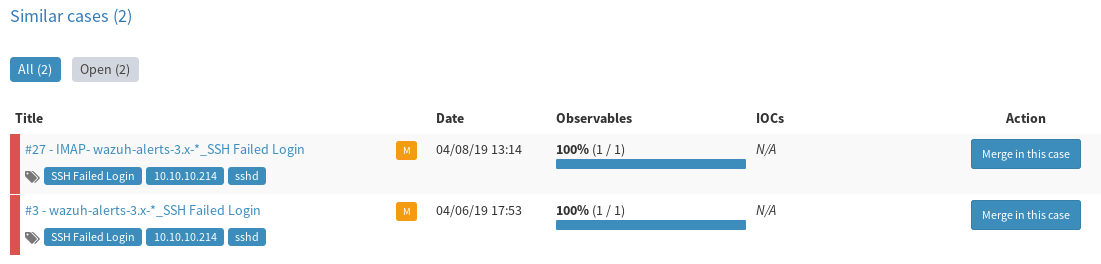
Click on the Alerts button at the top of the page. Here you’ll see a list of unassigned alerts waiting to be picked up by any available Analyst. Select an alert by clicking the Preview and Import icon off to the right. Here you’ll be able to see the alert details, along with the list of extracted observables. A Similar Cases section will appear at the bottom if any observable in this case has been seen before. If the two alerts share a link then you can opt to add this alert to an existing case instead of generating a new one.
There is an Import alert as drop down in the bottom right, next to the Import button. This allows you to assign a case template that will be used for case creation. Templates contain lists of predetermined tasks that should be preformed on the alert, more on that below. For now we can create an empty case.
Finally, choose Yes, Import to turn the alert into a case that will be assigned to you.
Case Management
TheHive allows Analysts to work together to complete tasks and close cases. Tasks and cases both support assignment to clearly differentiate who is responsible for what, while allowing everyone to follow along through the live stream.
Access your cases by clicking on TheHive logo in the top left corner.
Cases have 3 tabs in the main window (Details, Tasks, and Observables) as well as a live stream on the right-hand side showing task and status updates from all analysts.
The Details page shows metadata related to the case such as tags, date, severity, related cases, a description, and TLP and PAP designations.
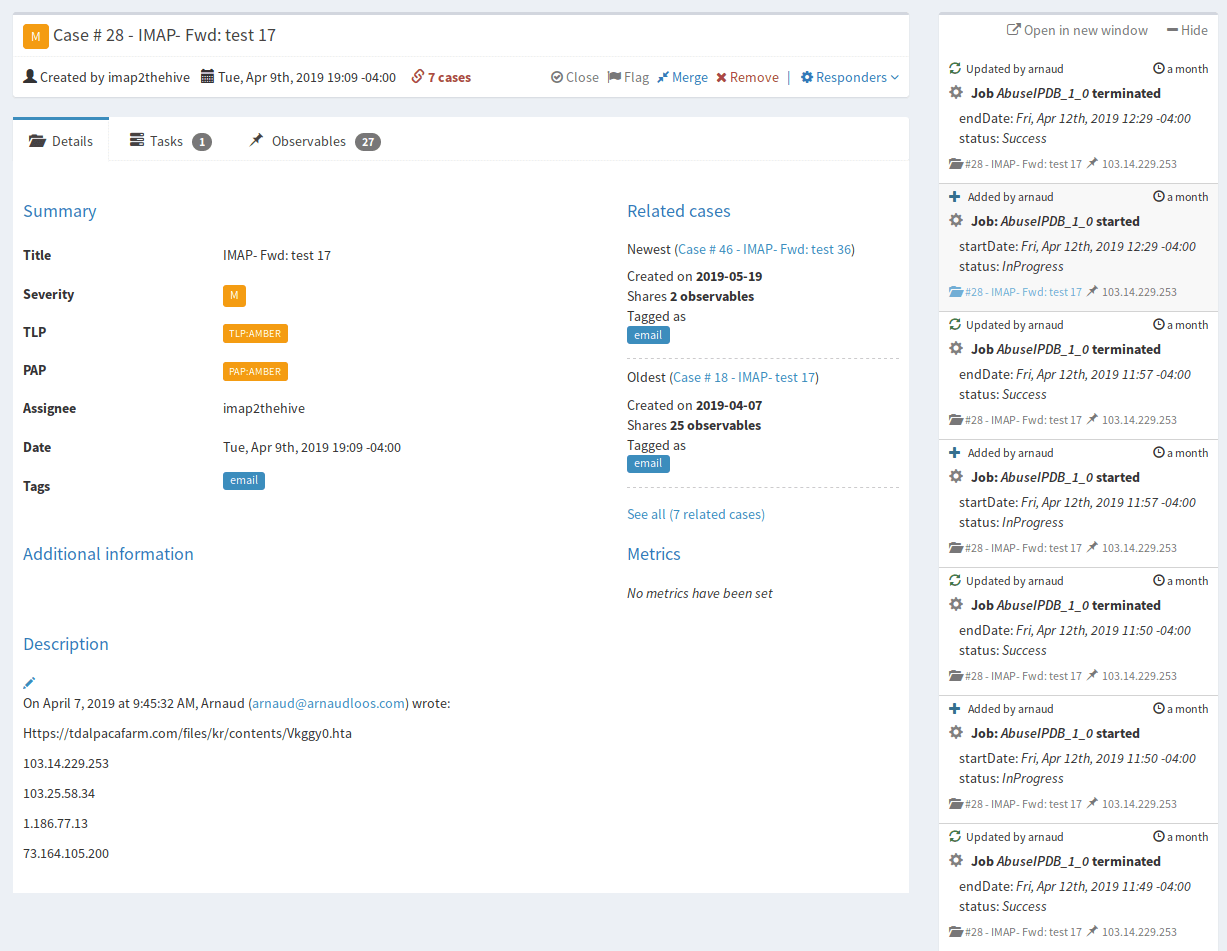
TLP is the Traffic Light Protocol which uses 4 color codes to indicate boundaries of how far outside the original group or recipient the information may be shared.
An example provided by TheHive website is: “For example, a file added as observable can be submitted to VirusTotal if the associated TLP is WHITE or GREEN. If it’s AMBER, its hash is computed and submitted to VT but not the file. If it’s RED, no VT lookup is done.”
PAP is the Permissible Actions Protocol which mimics the TLP but indicates to the analyst how they may use the IoC in investigating the alert. It dictates actions that may be taken with each IoC, such as active vs passive response.
The Tasks tab shows analyst defined tasks or those defined in an attached case template.
Tasks should be used to track the actions taken to answer investigative questions.
Tasks that you accept or which are auto-assigned to you show up in My Tasks at the top of the page. Tasks which have not yet been assigned are under Waiting Tasks.
The Observables tab shows all extracted observables and their type. The observable will have few if any tags until enrichment occurs. Click the observable value under Value/Filename (i.e. click on the IP or HTTP link) to open its details page. Here you’ll get additional metadata as well as links to other cases where the IoC is also present, and an Analysis section to run your Analyzers for enrichment.
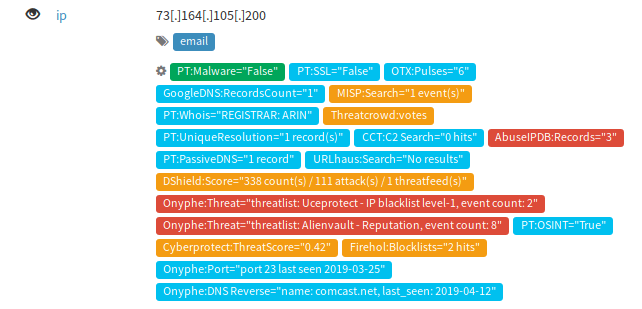
After running the Analyzers return to the Observables tab. Your IoC should now include tags summarizing the results.
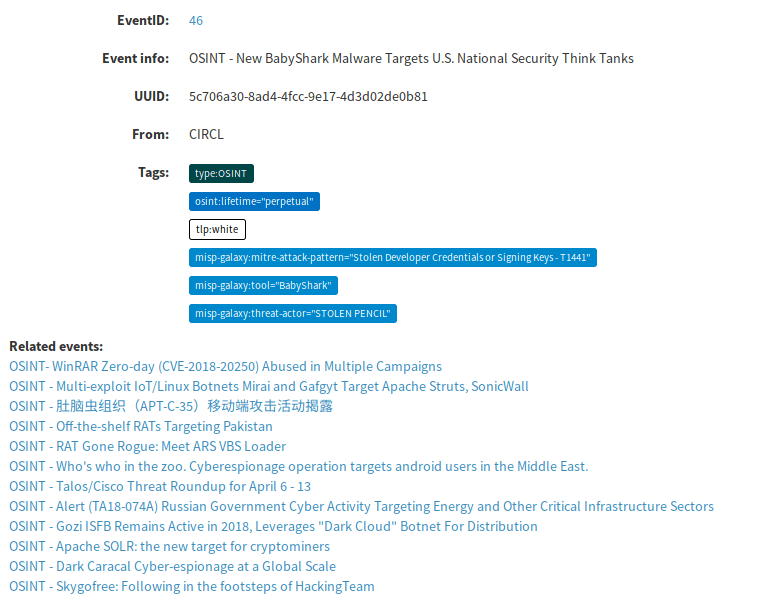
For more detailed results return to the IoC details page where the Analyzers are listed that you ran. Under Last Analysis click the date to view a more detailed report of the scan results.
Case Templates
Under the Admin menu at the top select Case Templates.
Here you’re able to give initial designations (Severity, TLP, PAP) for the IoCs in this alert category. You also provide a description and a task list to outline the investigative steps for this alert. This provides a consistent approach to handling events since the Task List becomes you’re investigative playbook. These should also reflect the actions defined in your SOPs.
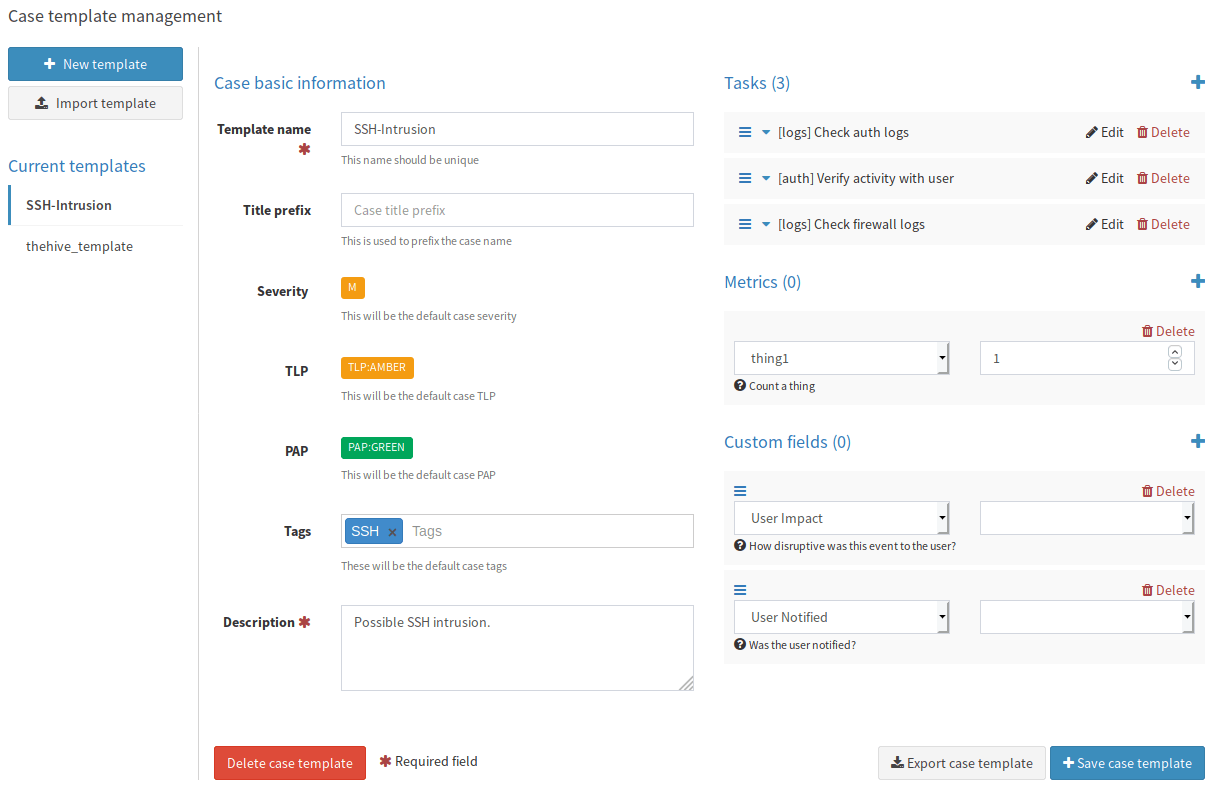
You’ll also see sections for Metrics and Custom fields. Items you select here must first be defined in the respective Case Metrics and Case Custom Fields sections under the Admin menu.
A case metric is merely a variable you define to increment. Metrics can also be displayed in graphs on the Dashboard.
A case custom field allows you to add additional fields for an Analyst to fill-in with the response as either a string drop-down, number, boolean, or date.
Responders
Responders are part of Cortex and are installed along with the Cortex-Analyzers.
Responders allow you to automate initiating an action. The default Responder provided as an example is the Mailer Responder which allows you to e-mail the case information and IoCs.
Enable the Mailer responder by adding the Responder section to the end of /etc/cortex/application.conf. This requires you to have downloaded the Cortex-Analyzers repository.
responder {
  path = ["/etc/cortex/Cortex-Analyzers/responders"]
  # Sane defaults. Do not change unless you know what you are doing.
  fork-join-executor {
    # Min number of threads available for analysis.
    parallelism-min = 2
    # Parallelism (threads) ... ceil(available processors * factor).
    parallelism-factor = 2.0
    # Max number of threads available for analysis.
    parallelism-max = 4
  }
}
Now login as the orgAdmin and configure and enable the Mailer responder.
The default repository for Responders is here.
Two additional Responders are also provided.
Cisco Umbrella Blacklister
Add domain from observables in cases to Umbrella blacklist.
https://umbrella.cisco.com/
Crowdstrike Falcon
Submit observables from alerts and cases to the Crowdstrike Falcon Custom IOC Service.
https://www.crowdstrike.com/endpoint-security-products/
If you find yourself with an abundance of free time you can always write your own Responder.
For instance if someone wanted to write a Responder to interface with StackStorm that would open a world of possibilities.
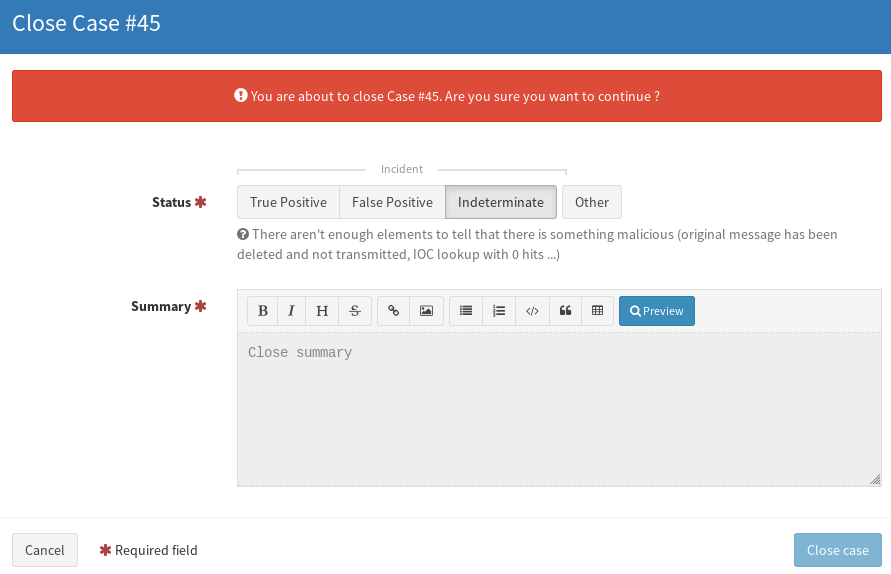
Case Closure
When you’re ready to close out a case click the Close button in the title bar of the case.
This will bring up the case resolution screen.
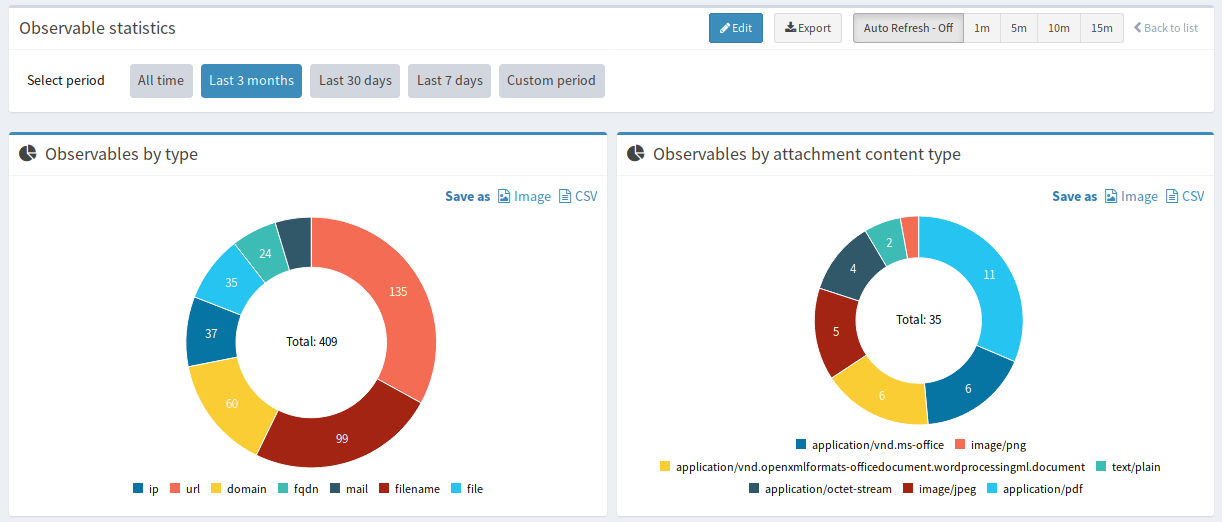
Dashboards & Search
Built-in dashboards for Case statistics, Observable statistics, Job statistics, and Alert statistics.
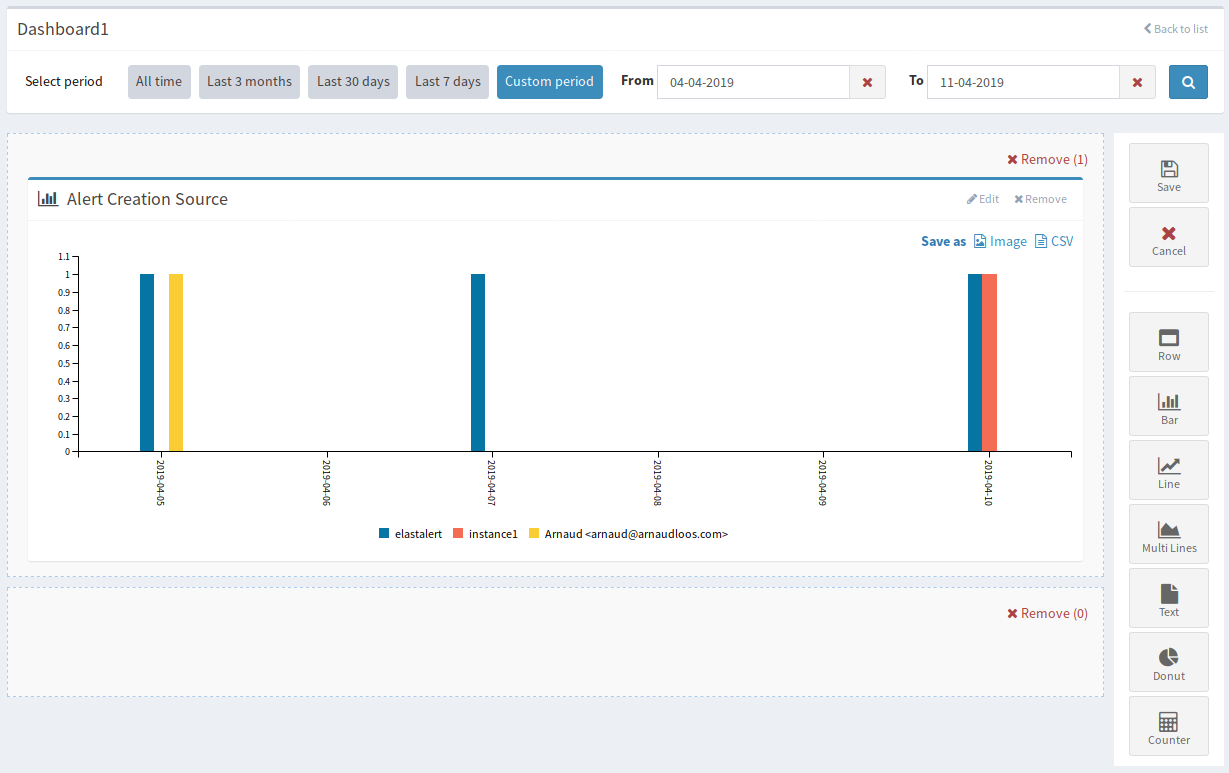
You can also build your own custom dashboards through a drag-and-drop interface.
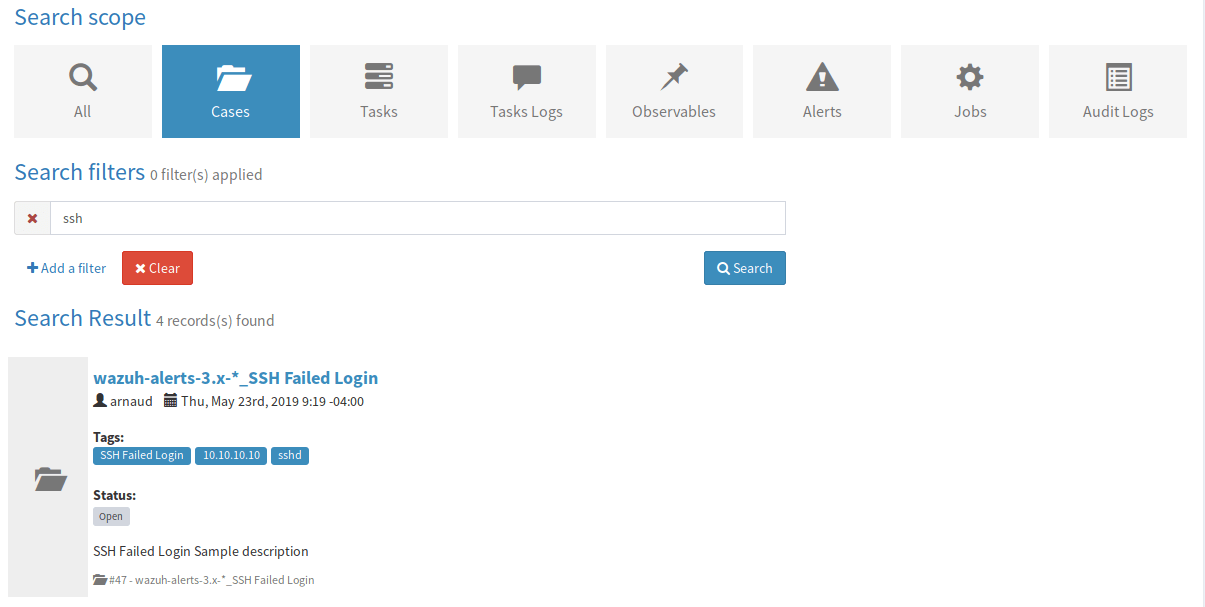
Search across Cases, Tasks, Task logs, Observables, Alerts, Jobs, and Audit logs.
Synapse, API, & TheHive4py
TheHive Project needs the help of the community to build additional Responders, integrations, and improvements, but makes it easy to do so with the following:
Most actions in TheHive are accessible over the REST API if you’re looking to connect or send from an external application.
If programming for TheHive or an application in the ecosystem, TheHive4py is the Python API client you’ll want to use.
Another project from TheHive creators is Synapse. Synapse is a “meta alert feeder for creating alerts in TheHive”. It’s a framework that can be expanded upon to ingest alerts from various sources. Currently it supports Microsoft Exchange, O365, and IBM QRadar. There are others in TheHive community building “connectors” to other SIEM products.
It’s been enjoyable working through TheHive stack and seeing firsthand how this could successfully be used within an organization to implement an SOC with as few as one or two Analysts. I look forward to building on this project even more by now attempting to integrate StackStorm to develop a full-fledged SOAR solution.