The inspiration for this project came from my aging 10 year old Boxer, Leah, who started experiencing seizures towards the end of her life. I hated not knowing if she had an episode while at home alone, and turned to remote monitoring as a solution. Unfortunately Leah passed before the project was completed, and so it got put aside. Recently however we’ve added a new member to the family, Muchacho, a Great Dane who suffers from epilepsy. While his seizures are mostly under control, they do occur and can occur when we’re not home. This seemed like a good time to revive the project.
Update July 6, 2019: I’m changing significant portions of this page today. Most notably I experienced a slow down in my transmission rate after recently flashing the collar, and the same issue on my D1 Mini collar. I can’t say for sure what caused it but switching away from the InfluxDB library that I was using in my code and transmitting raw UDP packets got me back up to speed. The other code change is that I’m now returning the absolute value of the sensor reading so that all my data points are positive. This allowed me to make some changes to the alerting as well. Both the collar listed below as well as the second version based on a D1 Mini are transmitting every 200ms to InfluxDB, and I think my alerting is set to eliminate most false positives.
While searching for other, similar projects, I came across this Github repo which seemed very inline with what I was trying to accomplish. Their project is a WiFi enabled accelerometer for general purpose use that reports data back to a Jupyter Notebook. Their wiring diagram was spot-on for my needs and I just needed to change the arduino code to report to an InfluxDB back-end instead. Many thanks to the students of the Texas Advanced Computing Center for their work.
The project components amount to about a $20 - $40 investment depending on the board you choose.
- Adafruit Feather Huzzah - $17 - Can be substituted with a $5 generic ESP8266
- FeatherWing Proto - $5
- Adafruit LIS3DH Triple-Axis Accelerometer - $5
- Short Header Pins - $2
- 2300mAh LiPo Battery - $8
Wiring the controller
I’ve linked to the fritzing diagram on their Github page to show a quick overview of the wiring but for more detailed wiring instructions and diagrams please visit the AccelerometerLogger Github page.
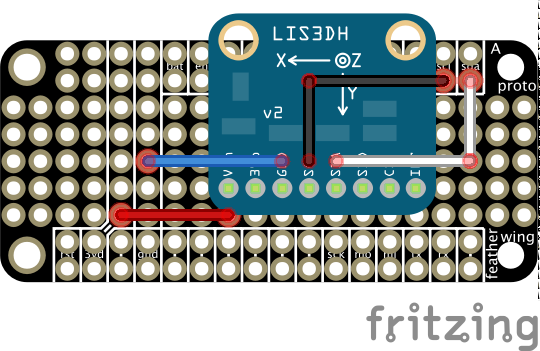
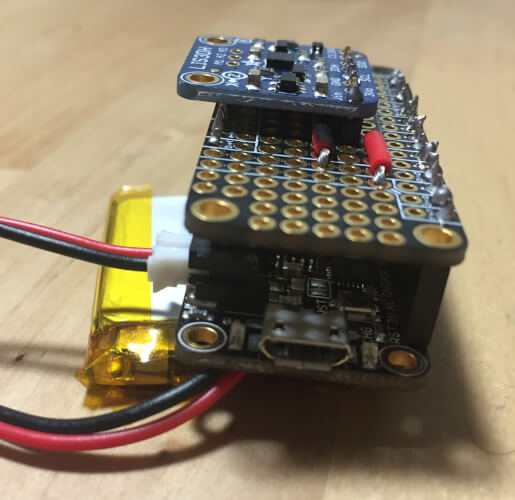
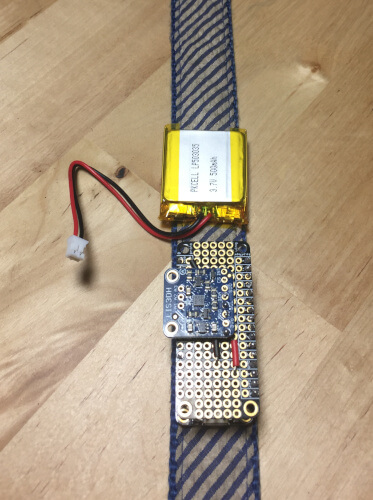
Here’s my completed prototype. Note that I went with the longer headers but recommend buying the short headers above. All that room in between is wasted space and when I do this again I’ll go for a more compact design with shorter headers. Actually I’ll probably use a Wemos D1 Mini and go even more compact. I may eventually add on a cellular transmitter and GPS so for a prototype this configuration has its advantages also.
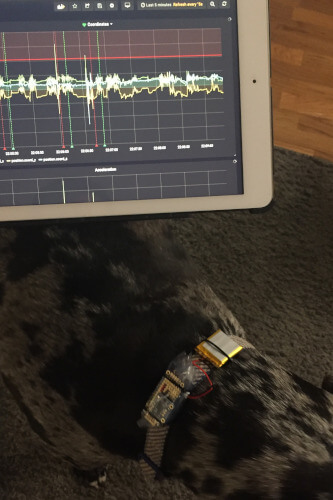
And its eventual home.
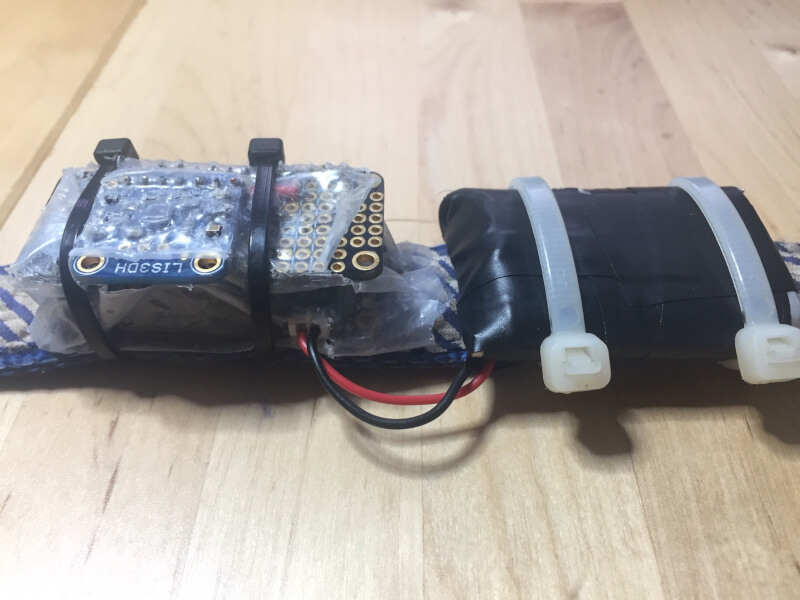
Here’s a current photo, battle scars included.
Arduino Code
Source code to upload through the Arduino IDE can be found on this project’s Github page.
There’s not much to it. You’ll need WiFi credentials and the IP of the InfluxDB server. You can adjust the sensitivity of the accelerometer if you wish.
Battery considerations
After much back and forth I’m using the following setup. I purchased a dedicated charger which can recharge at 500mA/h along with two 2000mAh batteries. My batteries recharge in under 5 hours and last over 24 hours. Every morning when Muchacho goes on a walk I swap out the battery and he’s covered until the next morning.
Please be careful. I’m becoming more aware of the dangers of puncturing these LiPo batteries. So far it doesn’t seem to be a problem for us since Muchacho doesn’t scratch at his collar. For other dogs however there is the risk of them puncturing a battery with their nails which would be very bad. Now that my setup is stabilizing my next step will be to design a more appropriate case for the entire system. For the time being you can see from the photo above that I’ve wrapped the battery in electrical tape for some small measure of added protection.
Setup InfluxDB & Grafana
I use Virtualbox running on my desktop to host a VM running Ubuntu 16.04 along with InfluxDB and Grafana. This does mean my desktop is on 24/7.
Once you have your VM running the setup is fairly straight forward. You’ll want to use the packages provided by the product teams so we’ll start by adding them before installing anything.
wget -qO- https://repos.influxdata.com/influxdb.key | sudo apt-key add -
source /etc/lsb-release
echo "deb https://repos.influxdata.com/${DISTRIB_ID,,} ${DISTRIB_CODENAME} stable" | sudo tee /etc/apt/sources.list.d/influxdb.list
sudo add-apt-repository "deb https://packages.grafana.com/oss/deb stable main"
sudo wget -q -O - https://packages.grafana.com/gpg.key | apt-key add -
Install everything.
sudo apt-get update && sudo apt-get install influxdb grafana
Grafana doesn’t need much configuring. We’ll set it to auto-start.
sudo -i
systemctl enable grafana-server.service
systemctl start grafana-server.service
It’ll be accessible at http://<serverIP>:3000. Login with admin:admin and change the password.
We need to configure InfluxDB to listen on a UDP port for the incoming data.
sudo nano /etc/influxdb/influxdb.conf
Scroll almost to the bottom and uncomment the UDP lines so they look like this.
[[udp]]
  enabled = true
  bind-address = ":8089"
  database = "collar1_udp"
I’m telling it to store all data that comes in on this port in a database named collar1_udp.
I now need to go create that database. As a standard user run the command influx on the command line to enter the InfluxDB shell. Now run CREATE DATABASE collar1_udp. When you run SHOW DATABASES you should now see that database listed.
Here’s a popular sequence I use a lot. I often wanted to “reset” and delete all my data and start over during testing. I would then re-create the database, select it, and monitor it for incoming data. Then probably make a change and start over. Here’s what that looks like, all these are run from within the InfluxDB shell.
DROP DATABASE collar1_udp
CREATE DATABASE collar1_udp
use collar1_udp
SELECT * FROM coordinates
You should see columns for x_coord, y_coord, and z_coord if you’re running my code when issuing that SELECT statement. This lets you know that your data is getting into the database.
In Grafana I created a dashboard showing the x, y, and z axis. The red horizontal line is my alert threshold.

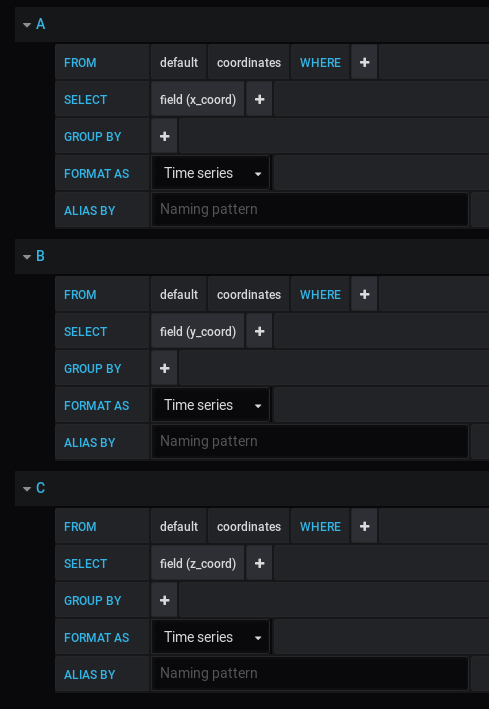
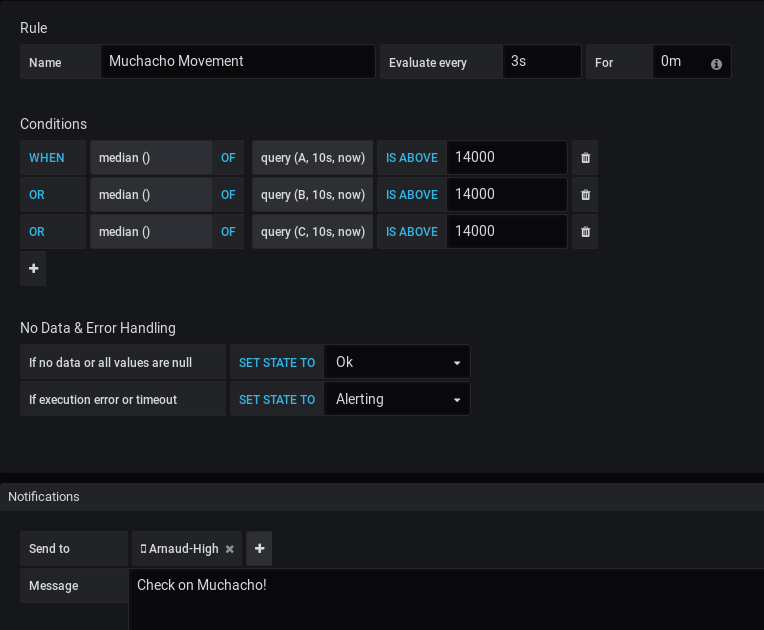
Note that I also changed If no data or all values are null to Ok in order to avoid alerts when data stops being received. I don’t want the alarm sounding at 2 AM if the battery runs out. I have a separate alarm with a low priority to notify me if data stops being received.
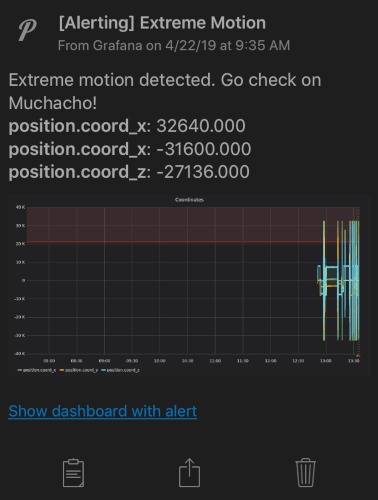
Alerting is through a threshold defined in Grafana with alerts being sent through Pushover, which is built into Grafana by default.
An alert received on my iPhone from Pushover.
Here’s the collar in action.
I have a second collar in the works based on a Wemos D1 mini. This will make the collar smaller and allow for battery monitoring as well. Once I spend a little time finalizing that design I’ll work on getting an appropriate case built.
In the meantime I’ll see if my new alerting strategy works but I feel pretty comfortable that we’ll get alerted if he seizes. Time will tell.
If you’re looking to implement something similar please reach out. I’ll keep updating this page as the project progresses.

